This article was first published in the Texas Almanac 2020–2021.
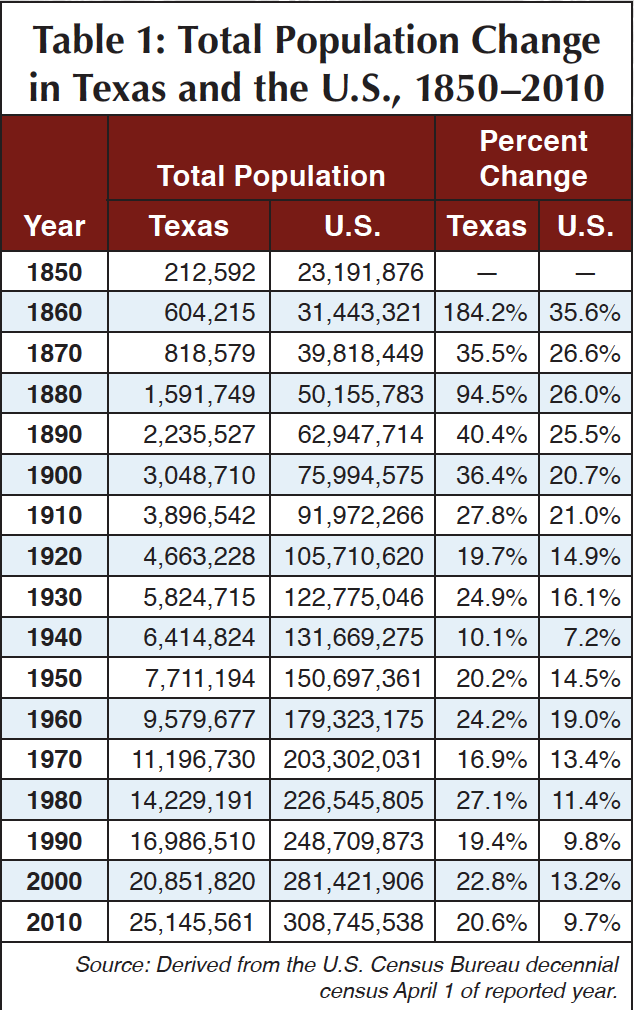
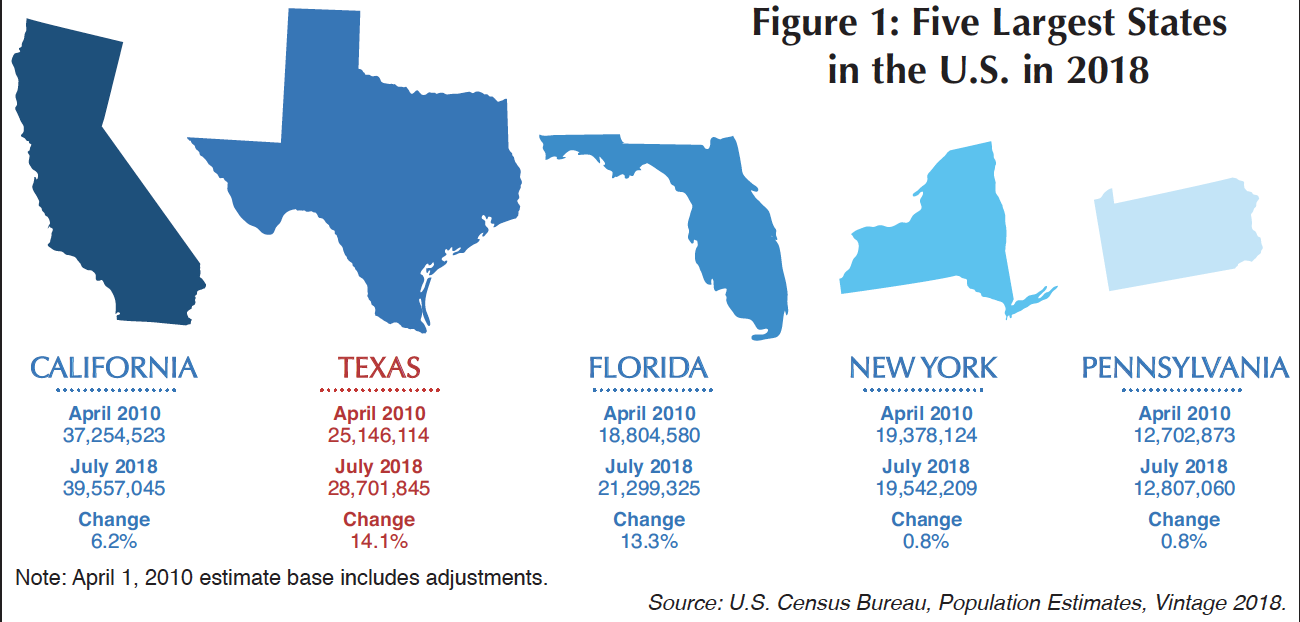
The population of Texas has increased during every decade since Texas became a state, with recent population growth exceeding that of all other states in the nation (Table 1). In 1950 the Texas population was the sixth-largest in the United States, but by the last decennial census count on April 1, 2010, at 25.1 million people, Texas’s population was the second largest in the nation behind California (Figure 1).
Two Decades of Dominant Growth in Texas
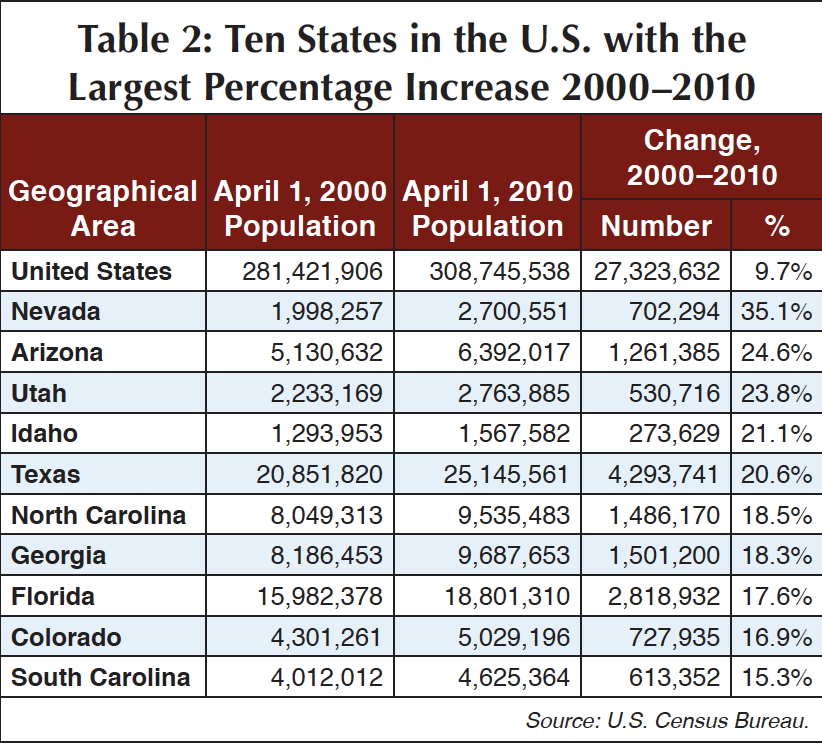
Between 2000 and 2010, Texas’ population increase of nearly 4.3 million was larger than that in all other states (Table 2) and its percentage growth of 20.6 percent exceeded that in all but four other states with much smaller populations:
- Nevada, which increased by 35.1 percent to 2.7 million in 2010;
- Arizona, which increased by 24.6 percent to 6.4 million in 2010;
- Utah, which increased by 23.8 percent to 2.8 million in 2010; and
- Idaho, which increased by 21.1 percent to 1.6 million in 2010.
According to the 2018 population estimates provided by the U.S. Census Bureau, Texas has, once again, added more people than all other states (an increase of 3.6 million people), and its percentage growth of 14.1 percent was surpassed by only Utah (which grew by 14.4 percent to an estimated 3.2 million by 2018). By July 1, 2018, there were an estimated 28.7 million people living in Texas.
Growth in the Texas Triangle and Permian Basin
While the state has experienced substantial growth over the last few decades, that growth has not been equally distributed throughout the state. Over the course of the 20th century and into the 21st, population growth has occurred primarily in the largest cities and their surrounding counties – particularly in an area commonly called the Texas Triangle (the areas along the I-45, I-35 and I-10 corridors between Houston, Dallas-Ft. Worth, and San Antonio).
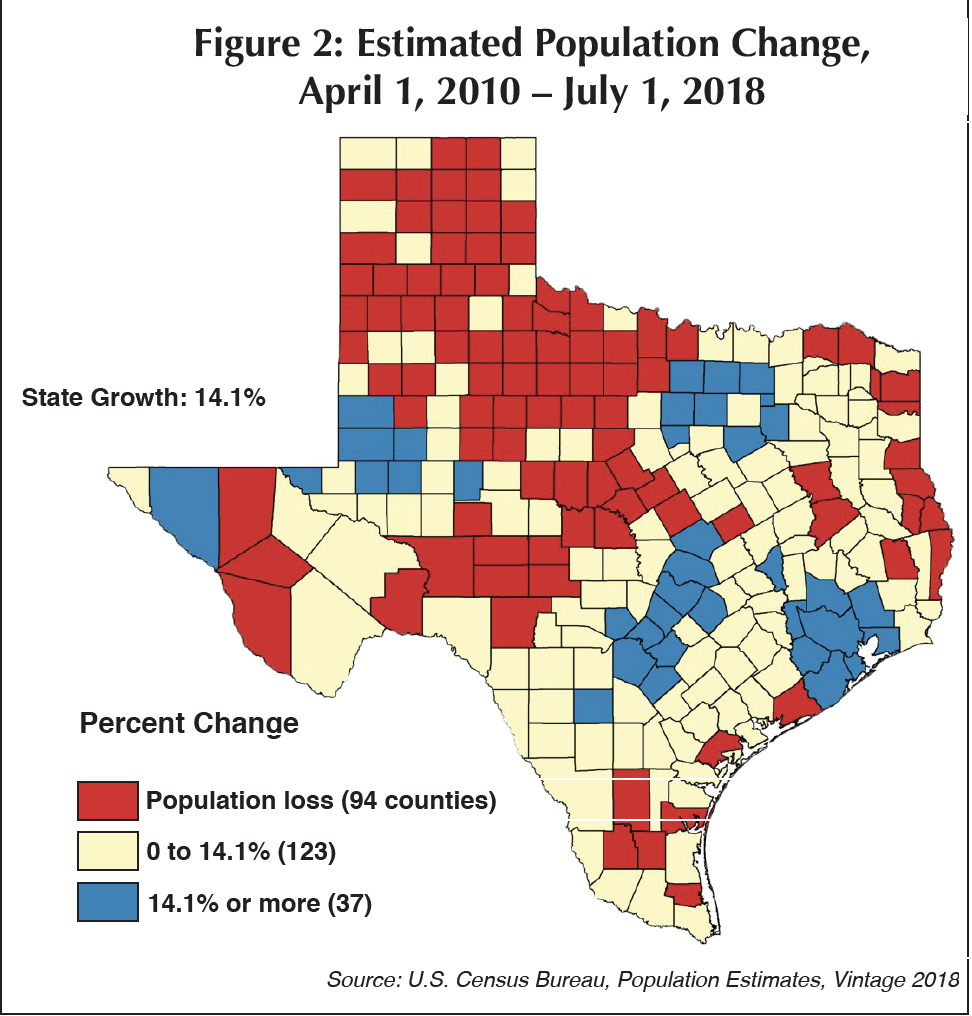
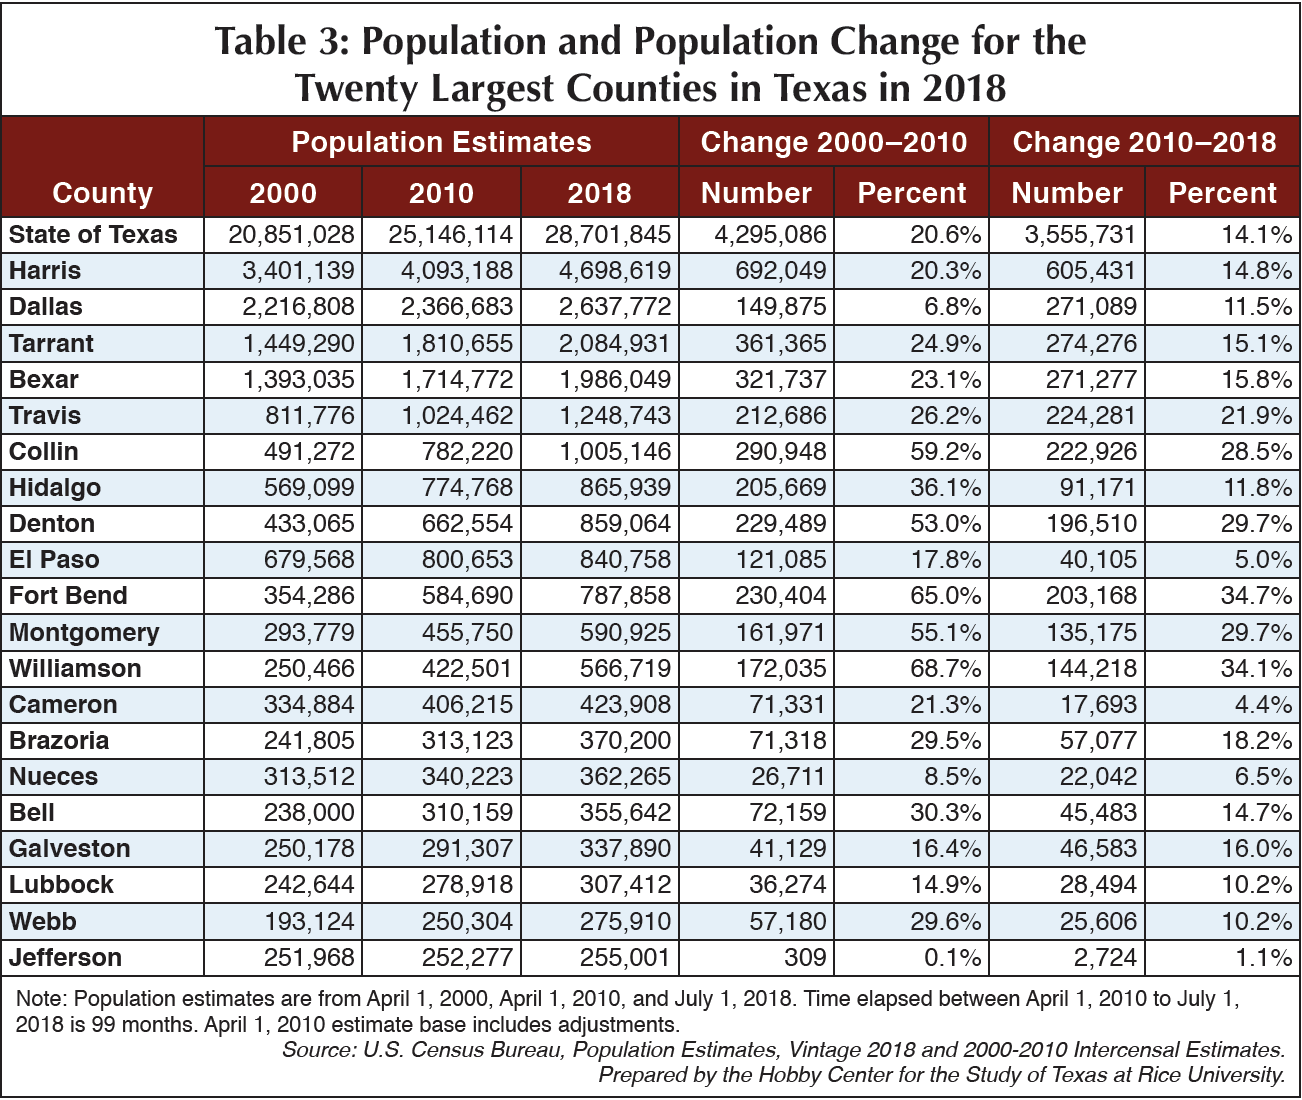
As you can see in Table 3, Texas’ most populated county, Harris County, increased by an estimated 605,431 people from 2010 to 2018, followed by Tarrant County (with a population increase of 274,276 people), Bexar County (with an increase of 271,277 people), Dallas County (growth of 271,089 people), and Travis County (an increase of 224,281). In addition, in the most recent period, counties in the Permian Basin and parts of South Texas experienced resurgent population growth as a result of oil and gas development (Figure 2).
But not all county populations are growing. Between 2010 and 2018, 94 counties in Texas lost population, more than the 79 counties that lost population between 2000 and 2010. Many of these counties are located in the Rolling Plains and Panhandle regions of Texas – traditional farming and ranching areas distant from larger urban conglomerations. The population in Texas has become increasingly urban.
Largest Rural Population in the Country – But Most Texans Live in Metro Areas
At 3.8 million people in 2010, there were more people living in rural areas in Texas than in any other state in the nation. Fifty-eight counties, or 22.8 percent of Texas’ 254 counties, had all of their population living in rural areas — on farms and ranches or in communities of fewer than 2,500 people. Another 78 counties (or 30.7 percent) had at least 50 percent of their population living in rural areas in 2010, while for the remaining 118 counties (or 46.5 percent) the majority of the population was living in urban areas.
Although Texas has a large rural population, the majority of Texans live in urban areas (or metropolitan statistical areas). In 2010, 84.7 percent of the Texas population lived in urban areas, and 75.4 percent lived in urban areas with 50,000 or more people.
Texas includes six of the 25 largest cities in the country including Houston (ranked fourth at 2.3 million people), San Antonio (ranked seventh at 1.5 million people), and Dallas (ranked ninth at 1.3 million people). Austin’s population is just below 1 million people (at 964,000). At current rates of growth, Austin is expected to have more than 1 million people living within the city by 2020.
Texas Metropolitan Areas Growing Faster Than Others in the Nation
The Dallas-Ft. Worth-Arlington Metropolitan Statistical Area (MSA) and the Houston-The Woodlands-Sugar Land MSA, ranked the fourth and fifth largest MSAs in the country, each added more than 1 million people between 2010 and 2018 — more than were added in the three largest MSAs in the nation combined.
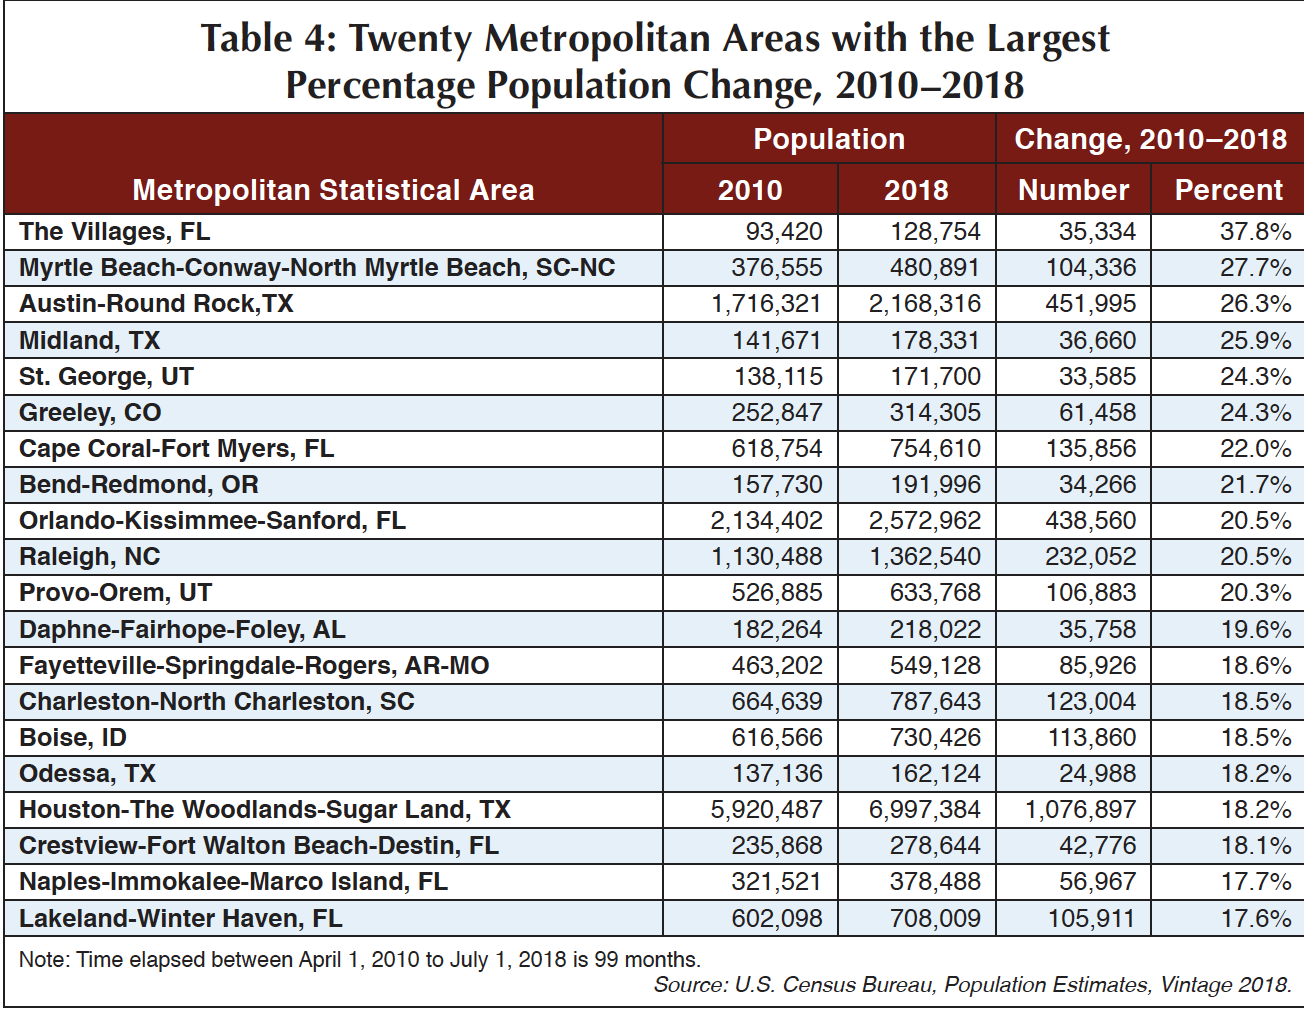
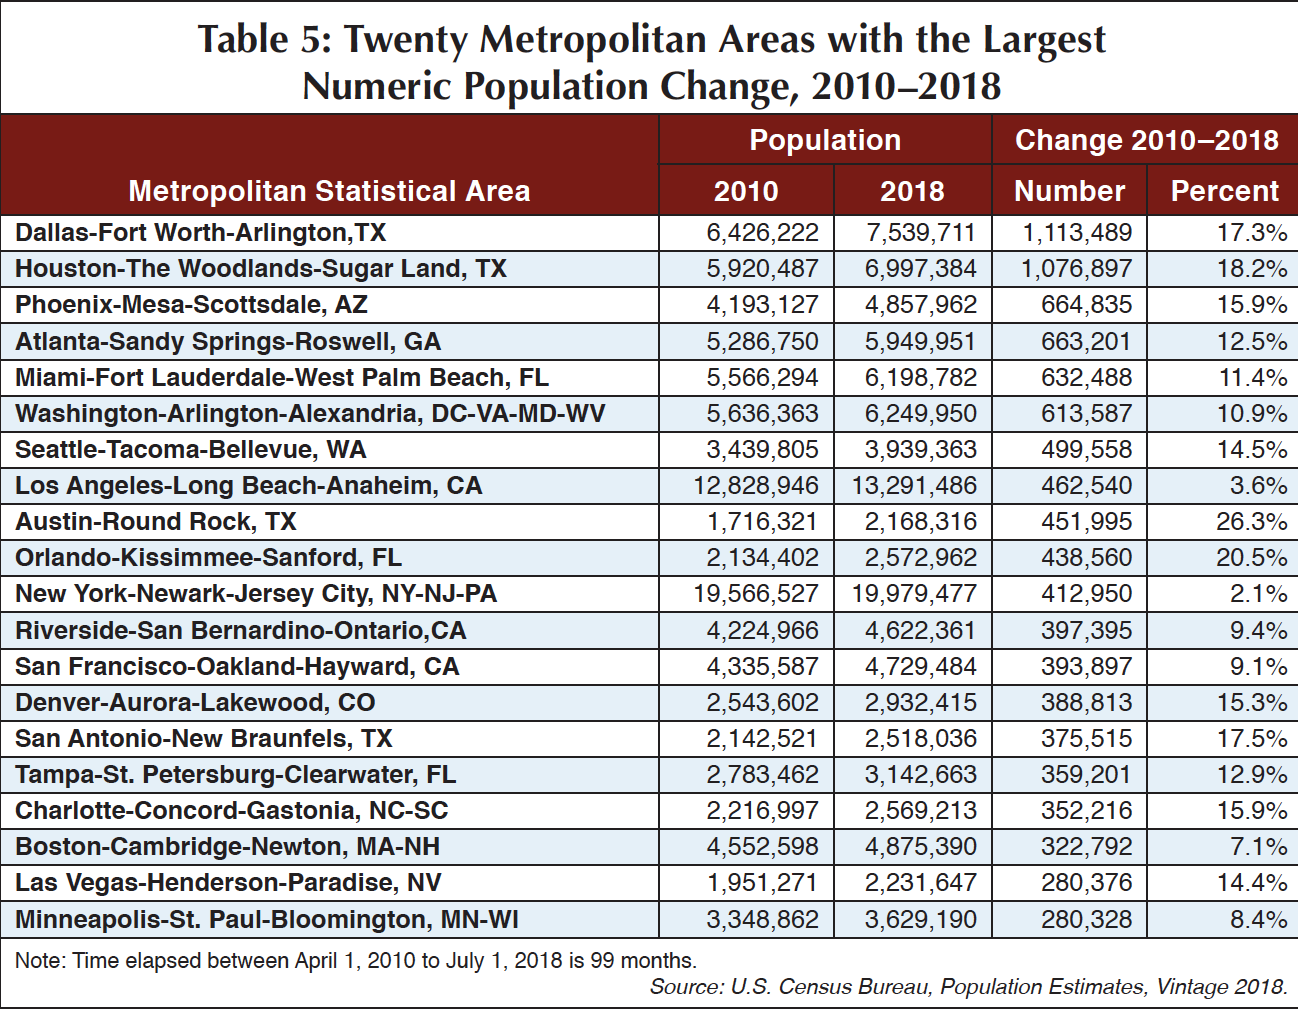
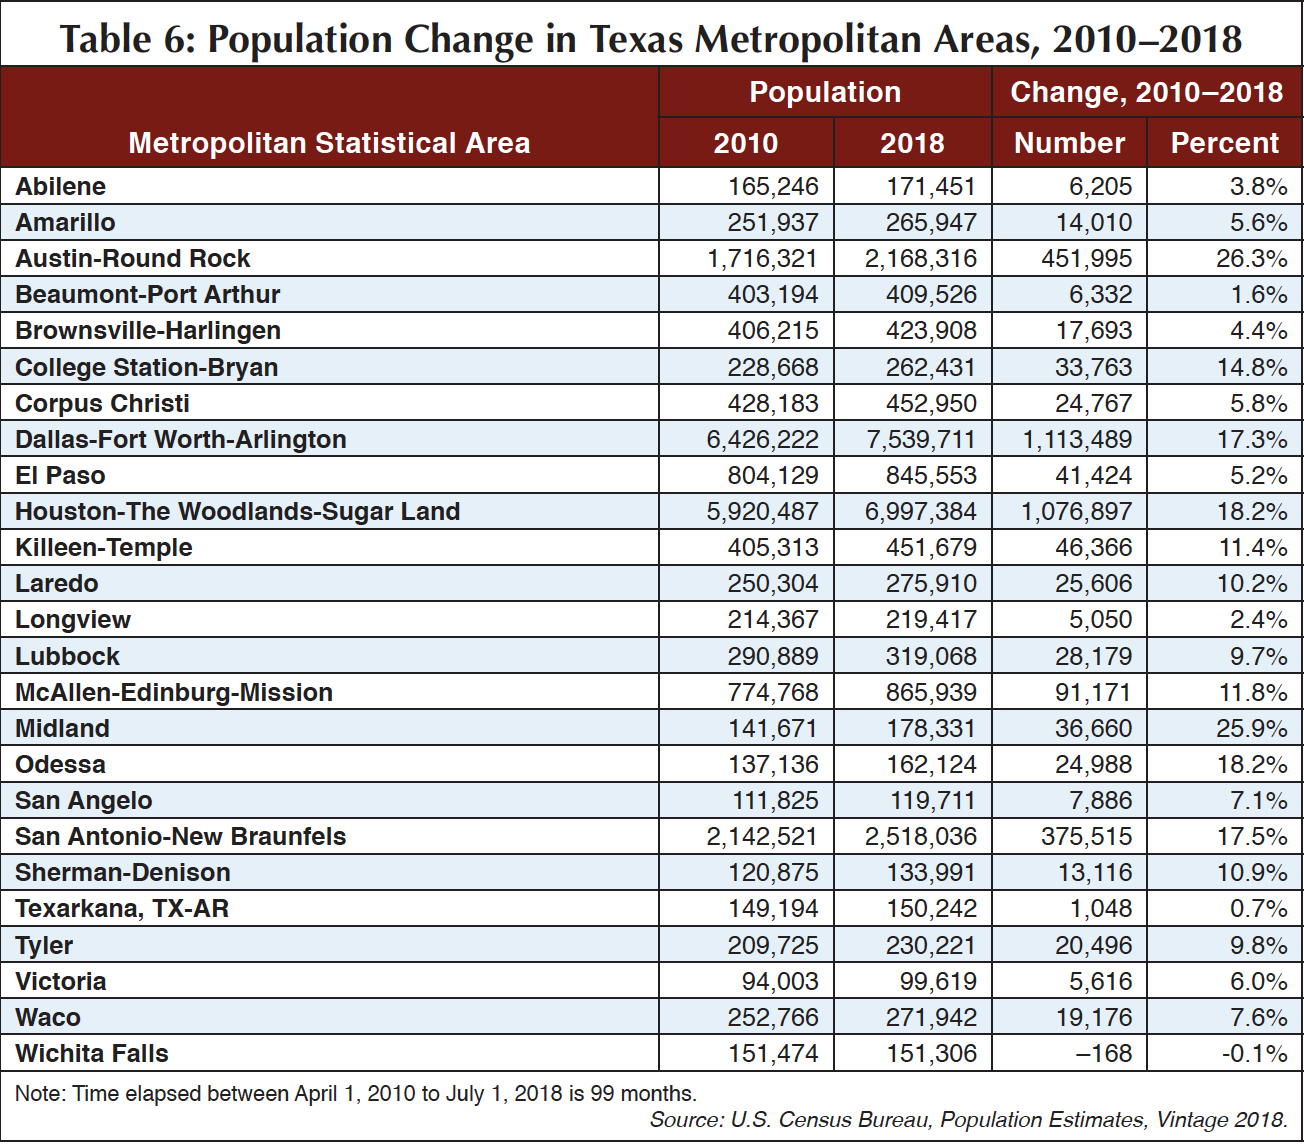
But growth has not just occurred in Texas’ largest urban conglomerations. An examination of MSAs relative to their numerical and percentage change in population from 2010 to 2018 in Table 4 and Table 5 indicates that the growth in Texas metropolitan areas is extraordinary.
Four Texas metropolitan areas were ranked among the nation’s fastest-growing areas in percentage terms between 2010 and 2018, including Austin-Round Rock, Midland, Odessa, and Houston-The WoodlandsSugar Land. The Austin-Round Rock MSA, with growth of 451,995 or 26.3 percent from 2010 to 2018, had the third-largest percentage increase in population (behind metropolitan areas less than a quarter its size). The two MSAs located within the Permian Basin, Midland (at 25.9 percent growth) and Odessa (at 18.2 percent growth), were ranked the fourth- and sixteenth-fastest-growing MSAs in percentage terms, respectively. Houston-The Woodlands-Sugar Land was ranked seventeenth-fastest-growing during this period — which is phenomenal given its large size (7.0 million people in 2018).
Texas’ two largest metropolitan areas were the only metropolitan areas in the nation to have added more than 1 million people since 2010. The Dallas-Fort Worth-Arlington MSA added 1,113,489 from 2010 to 2018 while the Houston-The Woodlands-Sugar Land metropolitan area increased by 1,076,897. The AustinRound Rock MSA was ranked ninth in numeric growth with an increase of 451,995 people while the San Antonio-New Braunfels MSA had the fifteenth-largest increase (it added 375,515 people).
According to the U.S. Census Bureau estimates, all other Texas metropolitan areas except Wichita Falls increased in population size during this period (Table 6).
Future Population Growth and Diversification in Texas
Texas’ population growth has been substantial, and, assuming this growth continues into the future, Texas will see increasing demands on public resources. At the same time, this growth bodes well for continued economic development within the state as an increasing population creates more opportunities for businesses and a growing labor force to meet that demand. But change in the characteristics of the population itself can also bring about change in the demand for public resources and business services. Relative to other states, Texas’ population is young, but as the baby boom generation enters retirement, a larger aged population will bring about increased demand for medical and other services to meet the changing needs of that aging population.
Demographers prepare population projections in order to assist governments, businesses, and nonprofits in planning for the future. Population grows as a result of natural increase (the excess of births over deaths) or positive net migration (more people moving into an area than moving out).
The Texas Demographic Center’s latest population projection, which assumes that recent trends in fertility, mortality, and net migration continue, indicates that Texas’ population is likely to grow substantially. In addition to this extraordinary population growth, Texas will continue to experience extensive racial/ ethnic diversification and an overall aging of the population.
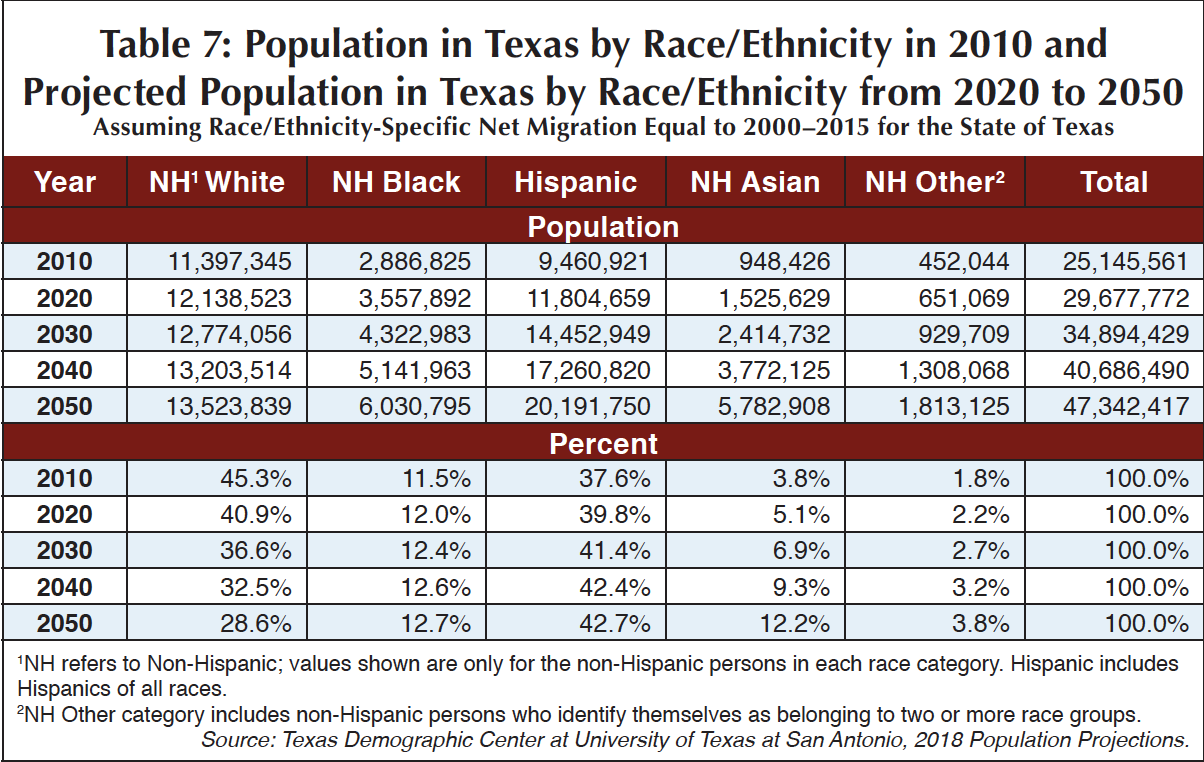
Under this projection scenario, the Texas population would almost double from 25.1 million people in 2010 to 47.3 million people in 2050 (Table 7). In addition, all race/ethnic populations will increase in size. The Non-Hispanic White population is projected to increase by 2.1 million people over the 40 years from 2010 to 2050. Over the same period, the Black population would increase by more than 3.1 million, the Hispanic population by more than 10.7 million, and the Non-Hispanic Asian population by about 4.8 million.
The analysis shown in Table 7 reveals the impact of diverse patterns of racial/ethnic change. Thus, under this projection, the percentage of the population that is Non-Hispanic White could decrease to 28.6 percent of the total Texas population (from 45.3 percent in 2010), the percentage African-American could increase to 12.7 percent, the percentage Hispanic could increase to 42.7 percent, the percentage Non-Hispanic Asian could increase to 12.2 percent (from 3.8 percent in 2010), and all other groups could account for 3.8 percent of the population by 2050. Under this projection, the Hispanic population will be the largest population in Texas by 2025.
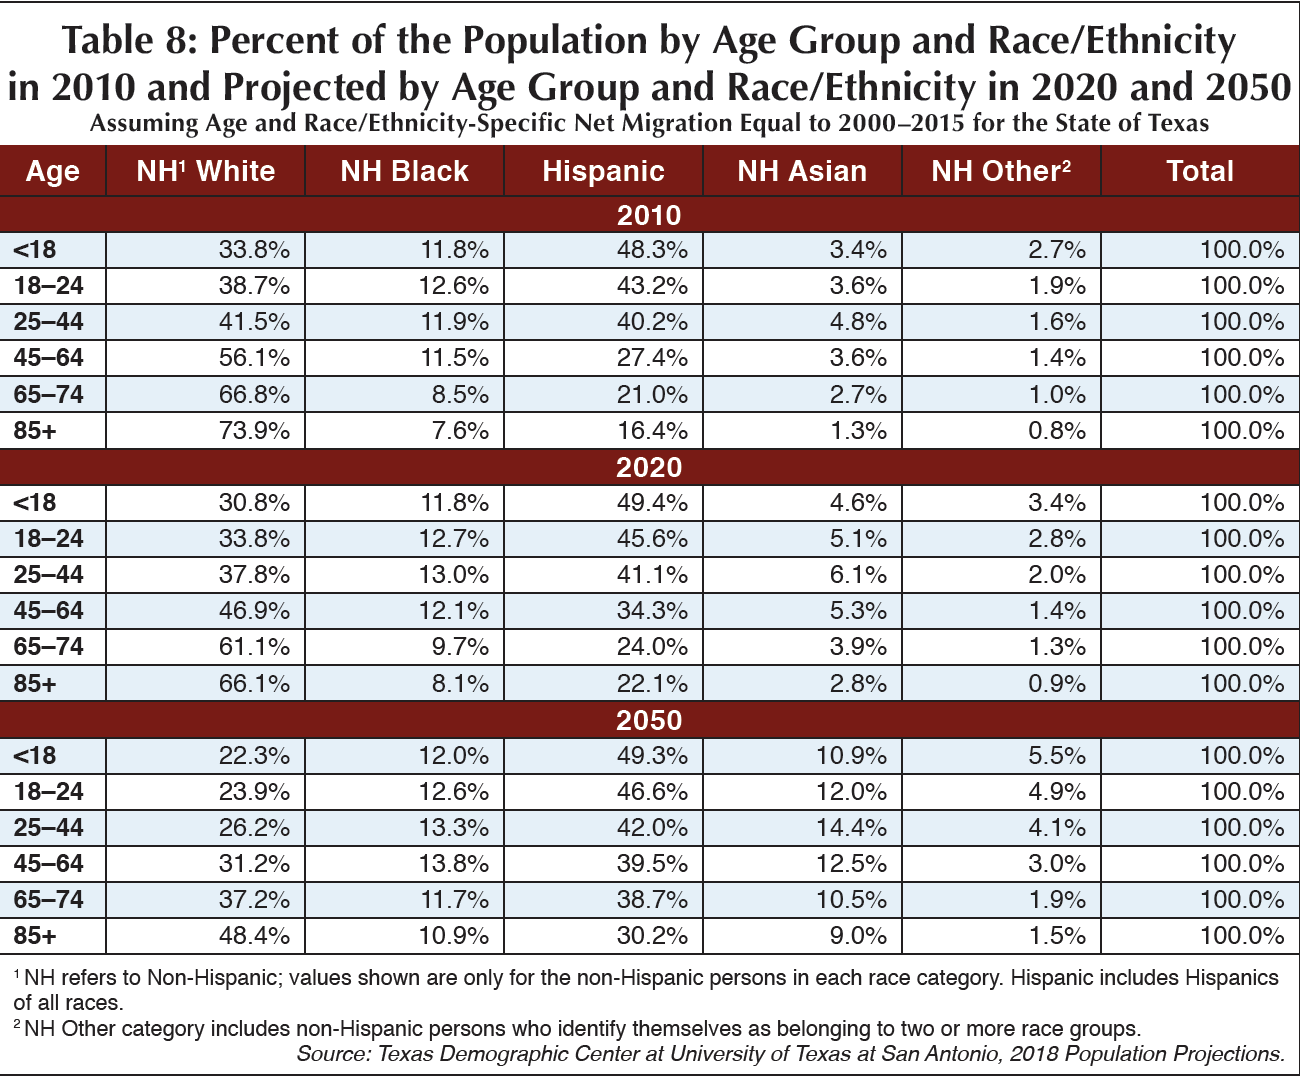
As shown in Table 8, Hispanics not only become the largest population group in numerical terms but, because of the extensive growth of the Hispanic population, although it has a younger population structure overall, it would come to account for the largest percentage in every age group but the oldest by 2050. How these changing demographic patterns will interact with other factors is not clear, but it is evident that all age groups will become more racially and ethnically diverse.
The elderly would become increasingly diverse, with Hispanics forming an increasing part of this population. The percentage of the elderly who are Hispanic would double from 2010 to 2050 (from 20.5 to 37.5 percent of the population 65 and older). Only Non-Hispanic Whites will see their representation in this age group decline.
Texas population is aging as well. In 2010, 10.3 percent of the population was age 65 or older, but by 2050 that percentage is projected to increase to 17.6 percent. In 46 counties in 2010, at least one of every five people were age 65 or older. By 2050, under the projections here, in 138 counties (more than half of Texas counties) the elderly will become 20 percent or more of the population.
If recent patterns in population growth and diversification continue, Texas will continue to be a leading state in the development of economic opportunities. At the same time, these demographic changes will likely continue to challenge the state in many different ways (such as developing and maintaining transportation infrastructure, developing additional water resources, ensuring that there is enough affordable housing, etc.). In addition, the state will be challenged to provide an array of educational opportunities to ensure that economic growth continues and is shared among all Texans. Its challenges are, at the same time, opportunities that should allow Texas to continue to be a place where opportunities may be developed and fulfilled for members of its relatively young and diverse population.
— Steve Murdock, Ph.D., is the founding Director of the Hobby Center for the Study of Texas and the Allyn and Gladys Cline Chair in Sociology at Rice University.
— Michael (Mike) Cline, Ph.D, a native of Snyder, currently serves as the State Demographer for the State of North Carolina.

